
Services
From seeing your data to acting on it.
Connected data solutions for smarter decision-making.
Solaris DeepSight is a professional data team providing end-to-end support — from data integration to visualization and automation.
Combining tools such as KNIME, Tableau, and SAP HANA, we organize data flows across departments and systems, and turn frontline challenges into real action.
The result: faster, more confident decisions, higher productivity, and accelerated innovation.
Here are the services Solaris DeepSight provides.
Turning the complex data accumulated on the shop floor and in your systems into practical insights.
From visualization and analysis to automation, we deliver flexible data solutions tailored to each challenge and goal.
[Manufacturing DX] Equipment Utilization & History Dashboard
Real-time utilization of every machine in a single view / History data that drives operational improvement
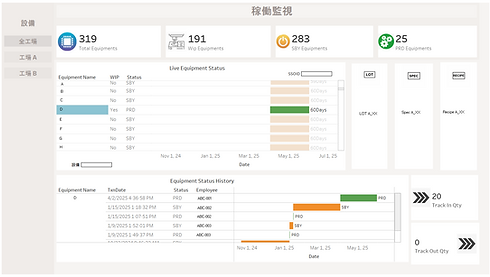
[Overview]
This dashboard visualizes equipment utilization on the manufacturing floor and manages its full history.
Built on a modern data-integration platform, it provides a single view of run/stop status (SBY / PRD / WIP, etc.) across all equipment.
Drill down dynamically into detailed status and history for each machine.
It contributes to operational improvement, higher productivity, and more efficient management on the shop floor.
Click an image to enlarge it.
[Manufacturing DX] Equipment Operating-Rate Monitoring Dashboard
Improve operating efficiency by making production equipment visible — and catch bottlenecks early
A "real-time × visualization × efficiency" solution for the DX era

Click an image to enlarge it.
[Overview]
This dashboard visualizes and monitors the operating rate of production equipment, clarifying how efficiently each machine is used and where improvement opportunities lie.
Based on WIP (work-in-progress) data, it analyzes utilization trends across equipment, operators, and time periods in multiple dimensions.
It supports early detection of bottlenecks and timely improvement actions.
Note: For confidentiality, the dashboard examples on this page are samples built with dummy data.
They may differ from actual client implementations.
Contact Us
Solaris DeepSight welcomes consultations on data visualization and dashboard development at any time.
"Could you build something like this?"
"Would this work with our own data?"
Specific questions and requests like these are always welcome.
Please reach out via our Contact page.
👉 Get in touch
Email: